History of Data at Clear Street
Clear Street’s data journey has undergone multiple iterations since our founding in 2018. Our engineering team takes a deep dive into how our data platform has evolved as we’ve grown from a US equities platform to adding fixed income, securities lending, execution, margin financing, repo and more.
Initial Architecture
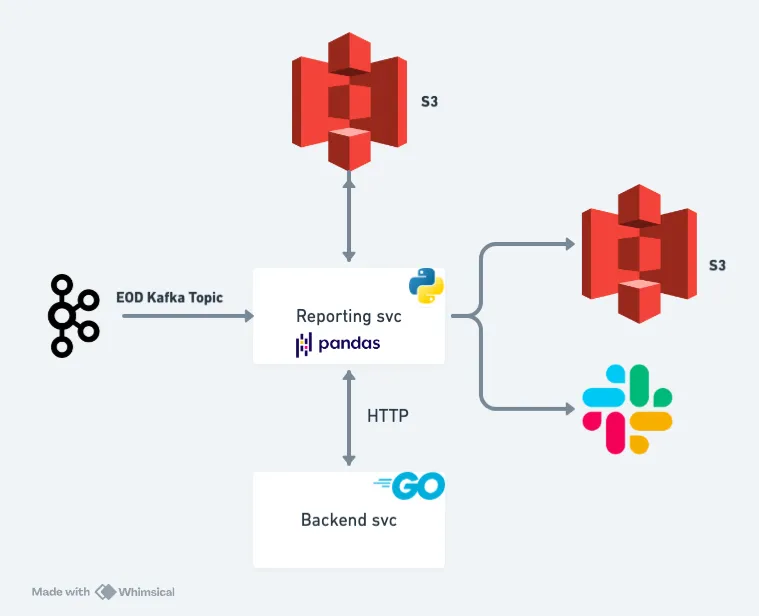
In its early days, Clear Street’s data platform components primarily leveraged Postgres, AWS S3, Kubernetes, and Kafka. Our backend microservices were typically written in Go (and still are) and kept state via Postgres. Our reporting jobs were written in Python due to the plethora of data-related libraries that Python has to offer. End-of-day (EOD) reconciliation reports, which ensure our books and records align with a vendor's, are quite common. A typical reconciliation workflow from that time might have looked like this:

We deployed Python jobs as a Kubernetes StatefulSet, and these jobs would commonly listen to a Kafka topic that would produce EOD events. This EOD event is emitted when our system rolls over to the next business day and our T-1 data is considered immutable. When the EOD event was polled by the job, the following workflow logic would begin:
1. Fetch vendor report from S3 – read as Pandas dataframe
2. Make HTTP requests to backend microservice – read as Pandas dataframe
3. Join the two dataframes on a common key
4. Output the “matches” and “mismatches” report to S3 and/or Slack
5. Commit the Kafka message
Limitations
Moving quickly was extremely important to us, and this strategy allowed us to do just that. We created internal tooling for this process which made it simple to deploy new reporting jobs. However, there were some clear downsides to this methodology, mainly:
- Reports were typically generated once a day. Because these jobs were deployed as a Kubernetes StatefulSet, they would run 24/7 in our cluster, resulting in unnecessary resource allocation.
- Scraping backend APIs can take a while, especially when pagination is involved.
- Kubernetes pods sometimes experienced out-of-memory issues due to data volume.
- Report dependency was difficult. If one report required the completion of another report, we didn’t have a robust method of defining this dependency graph.
- Our backend microservices were serving many similar API requests, which caused database and compute usage contention with our transactional systems.
Phase Two
We knew the initial architecture of our data platform would have scaling issues as data volume increased, but again, we were prioritizing feature development with a small engineering team. As we onboarded more clients and data volumes grew, we eventually reached an inflection point where we knew we needed to introduce a data warehouse into our tech stack. At the time, our two front runners were Redshift and Snowflake. Ultimately, Snowflake won due to its light learning curve, SaaS architecture, and overall rich feature support.
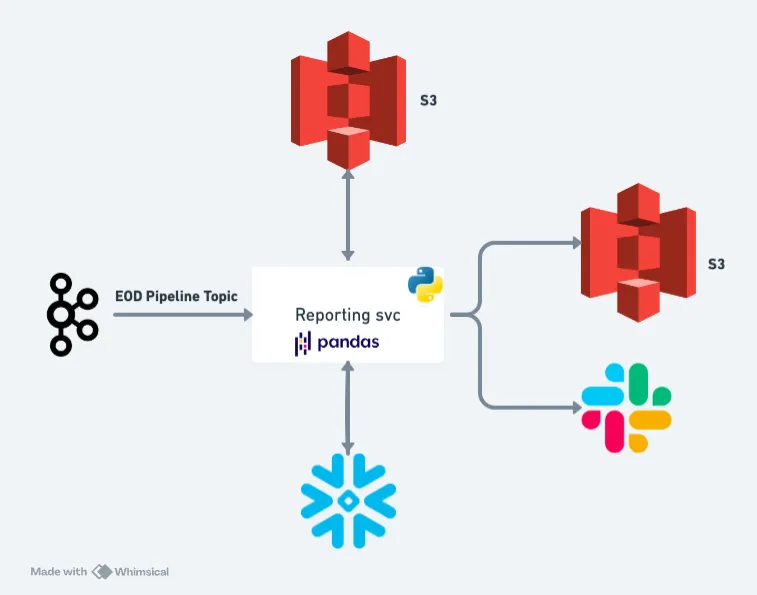
Our goal was to transition our reporting jobs to Snowflake, so we first needed to develop data pipelines that loaded backend microservice data as well as S3 file data into Snowflake. All of our backend microservices produced messages to Kafka via Debezium or some other implementation of the Transactional Outbox Pattern. That is to say, our microservice data is generally replicated to Kafka topics.
The data we needed to load to Snowflake was mainly sourced from Kafka and S3. AWS offers the ability to produce a SQS queue whenever S3 is modified, allowing us to create event-driven extract, transform, and load (ETL) pipelines.

We created in-house tooling that allowed us to quickly instantiate new ETL pipelines, however, this introduced a new challenge to our system: How do we ensure that all of the end-of-day data is in Snowflake prior to running a reporting job?

By leveraging Snowflake for our reporting tasks, we've seen a dramatic improvement: jobs that once took hours now completed in just minutes! This ETL approach allowed us to run on-the-fly transforms, which proved very beneficial when some of our Kafka topics occasionally contained incomplete data or required a small transformation before loading to Snowflake.
Additionally, we adopted Argo Workflows as our workflow orchestrator, allowing us to easily define workloads in the form of a DAG (directed-acyclic-graph). We leveraged Argo Events, enabling us to define event-driven workflows. Because Kubernetes and Kafka are at the core of our engineering platform, Argo was a good fit for us.
Limitations
- These pipelines were slow. Our Kafka topics were only single-partitioned and our pipelines were written in Python. Our validations ran at EOD, and if we detected any issues with the data that warranted a reprocessing, it quickly became a timing issue for all of our downstream EOD reporting because reprocessing a day's worth of data could take up to a few hours.
- Backfilling data took a long time. The need for backfilling data varies from instantiating a new pipeline that requires reading from the earliest offset, schema changes, recognizing bad transform logic, etc. However, backfilling could be a very expensive operation. As mentioned above, it could take multiple hours for a single day’s worth of data. If we apply this efficiency over several months, backfilling data could be finished in a matter of days.
- Data observability was minimal. If you wanted to know how a row of data landed in a table, you had to look at the source code. This became especially cumbersome when business analysts started using data in Snowflake. We didn’t have a simple answer to data lineage.
- S3 file loading was synchronous. If one file took a long time to process, then this would delay all files downstream.
Current Iteration
We grew fast, and scaling our entire system became a focal point in engineering. As a result, we improved our data standards around Kafka and tightened our APIs. Our high-volume Kafka topics transitioned to multi-partitioned topics, allowing downstream consumers to scale horizontally.
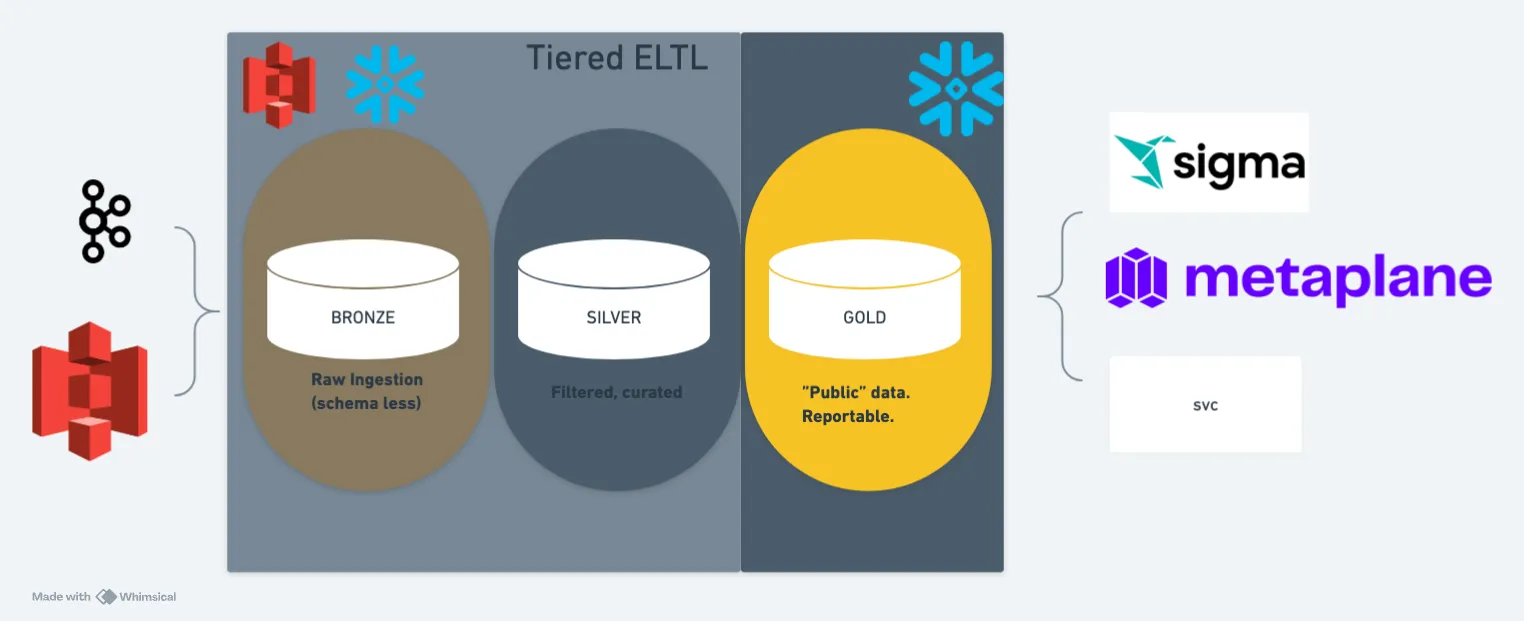
This is when we transitioned from an ETL (extract-transform-load) data-loading style to an ELT (extract-load-transform) style. We followed a data warehouse medallion architecture where data lives in multiple layers or “tiers.”

In this ELT style, the bronze tier serves as a “raw” data layer, where data is untouched from the source. This tier is typically in AWS S3 and/or Snowflake. The silver tier is meant to represent cleansed and conformed data, and the gold layer is curated business-level tables. The gold tier is meant to act as public data, akin to an API, where data versioning is strongly enforced. When teams wish to access another team's data, they can do so via their gold layer. This allows for teams’ data encapsulation. We provisioned per-team federated databases, meaning that each team was responsible for populating its bronze, silver, and gold data tiers and had some level of data engineering responsibilities. Pivoting to a medallion data warehouse architecture gave our pipelines a clear distinction between loaders and transformers.
Extract-Load
Our loaders mainly consist of two technologies:
1) Kafka data loading via the Snowflake Kafka Connector. Our Kafka topics typically contain raw Protobuf data, and we store our Protobuf schemas in Buf Schema Registry (BSR). Because Kafka Connect doesn’t natively integrate BSR, we wrote our own plugin.
2) We wrote an in-house tool for S3 file loading, utilizing Argo Events to spawn a workflow per AWS SQS event. This task queue style of processing messages allows us to process many files in parallel.
Both loaders load to a “bronze” data tier, where the contents of the data are schemaless (a json blob). There are also additional metadata columns for each loader, for example the Snowflake Kafka Connector provides a record_metadata column providing Kafka message metadata (topic, partition, offset, time, etc). Our S3 file load tool provides metadata such as S3 key name, last modified timestamp, e-tag, etc.
Transform
After data lands in the bronze layer, we need some methodology to transform this data to the gold tier. For this tool, we picked dbt. Ultimately this was a very easy pick for us due to the simplicity, versatility, and community of dbt. Additionally, adding dbt to our tech stack allowed our business analysts to construct their own data pipelines oftentimes without needing the support of an engineer.
Deployment Strategy & Management
As mentioned previously, each engineering team requires some level of data engineering. What teams want to focus on in these pipelines is the business logic, not the implementation details that are required for instantiating a date pipeline – e.g, idempotency, retries, backfill details, handling ad hoc runs, Kubernetes resource deploys, etc.
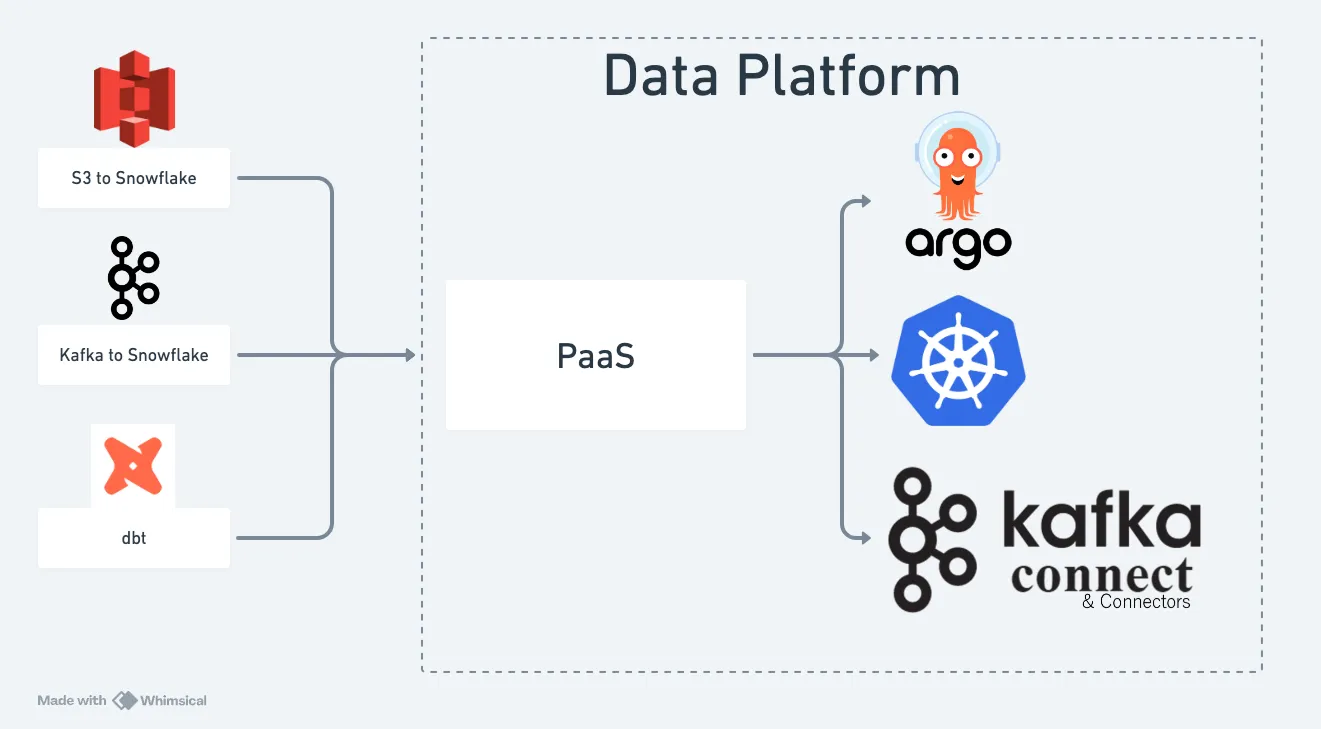
Because of this, our data platform team has pivoted towards offering our existing tools as a Platform as a Service (PaaS). Examples:
- Kafka to Snowflake – teams instantiate Kafka connectors via populating a yaml file that describes which topic to sync to Snowflake, as well as the database, schema, and table name. No Kafka Connect knowledge is necessary!
- S3 to Snowflake – teams instantiate S3 to Snowflake pipelines by populating a yaml file that describes the S3 key regex to match on, and which Snowflake database, schema, and table to load to. No code is necessary!
- Managed dbt deployments – teams instantiate their dbt projects by populating a simple template that accepts any dbt runtime flags (select, target, full refresh, etc) as well as a cron schedule (and will soon support event-driven jobs) to run on. This ultimately gets deployed as Argo workflows, but teams do not need to write any Argo Workflow logic!
Providing our tooling as a PaaS allows developers to focus on business logic and helps alleviate the engineering complexities of creating a pipeline. It also provides non-engineers with the ability to create end-to-end data pipelines.
Clear Street’s evolution of our data platform from conception to its current state exemplifies our commitment to innovation and scalability within the industry. By navigating early challenges and leveraging different programming software to optimize reporting and data processing capabilities, we have prioritized data integration and created an environment where our engineers can amplify business impact.
If our engineering journey has piqued your interest, visit our careers page to learn more about our open roles.

Get in touch with our team
Contact usClear Street does not provide investment, legal, regulatory, tax, or compliance advice. Consult professionals in these fields to address your specific circumstances. These materials are: (i) solely an overview of Clear Street’s products and services; (ii) provided for informational purposes only; and (iii) subject to change without notice or obligation to replace any information contained therein. Products and services are offered by Clear Street LLC as a Broker Dealer member FINRA and SIPC and a Futures Commission Merchant registered with the CFTC and member of NFA. Additional information about Clear Street is available on FINRA BrokerCheck, including its Customer Relationship Summary and NFA BASIC | NFA (futures.org). Copyright © 2024 Clear Street LLC. All rights reserved. Clear Street and the Shield Logo are Registered Trademarks of Clear Street LLC


